WASDE June 2026: Soybean Oil Remains Strong, Wheat Mixed, Corn Slightly Pressured
The June WASDE was not a broad shock report, but it delivered several important trader signals. Soybean oil remains the clearest bullish story due to persistent biofuel demand, wheat is tighter in the United States but mixed globally, while corn faces slight pressure from higher global ending stocks.
Wheat
U.S. production and ending stocks were lowered, but larger crops in Russia, Turkey, and Ukraine offset part of the bullish U.S. story.
Corn
The U.S. balance sheet was almost unchanged, but global corn ending stocks were raised by 3.7 million metric tons.
Soybeans
The U.S. soybean balance sheet was unchanged. Production, crush, exports, ending stocks, and price projections all stayed the same.
Soybean Oil
Biofuel use remains extremely high at 17.8 billion pounds, keeping soybean oil the strongest story in the soy complex.
Sugar
U.S. sugar production and ending stocks were raised, while the stocks-to-use ratio increased to 14.3%.
Cotton
U.S. and global ending stocks were reduced, while world consumption was slightly raised.
June WASDE: less dramatic than May, but still important
The June WASDE was much less aggressive than the May report. May created the first full 2026/27 framework and introduced several major shifts, especially in wheat and soybean oil. June was more about fine-tuning those assumptions.
That does not make the report irrelevant. For traders, the important question is not only whether the USDA changes the balance sheet dramatically. The more relevant question is whether a market continues to confirm or reject the previous month’s fundamental narrative.
From that perspective, the June report keeps three themes alive:
- Soybean oil remains structurally supported by biofuel demand.
- Wheat remains a weather-risk market, but the global balance sheet is less cleanly bullish than the U.S. balance sheet.
- Corn is not receiving fresh bullish support from WASDE and now needs weather or demand confirmation.
Wheat: U.S. tighter, but global supply offsets the story
Wheat remains one of the most interesting agricultural markets after the June WASDE, but the report was not as cleanly bullish as May.
U.S. all wheat production was reduced to 1.543 billion bushels, down from 1.561 billion in the May projection. The national yield was lowered from 47.5 to 47.0 bushels per acre, mainly due to smaller Hard Red Winter wheat production.
U.S. ending stocks were also lowered from 762 million to 744 million bushels. That is supportive from a domestic balance-sheet perspective.
The complication is the global side. World wheat production was raised from 819.1 to 820.1 million metric tons. Russia was increased to 88.0 million tons, Turkey was raised to a record 22.5 million tons, and Ukraine was also revised higher. Australia was lowered, but not enough to turn the global balance sheet clearly bullish.
From a trading perspective, wheat is still a market to watch, but I would not treat this report as an automatic long signal. The U.S. data is supportive, but price needs to confirm that traders care more about the tighter U.S. picture than the larger global supply revision.
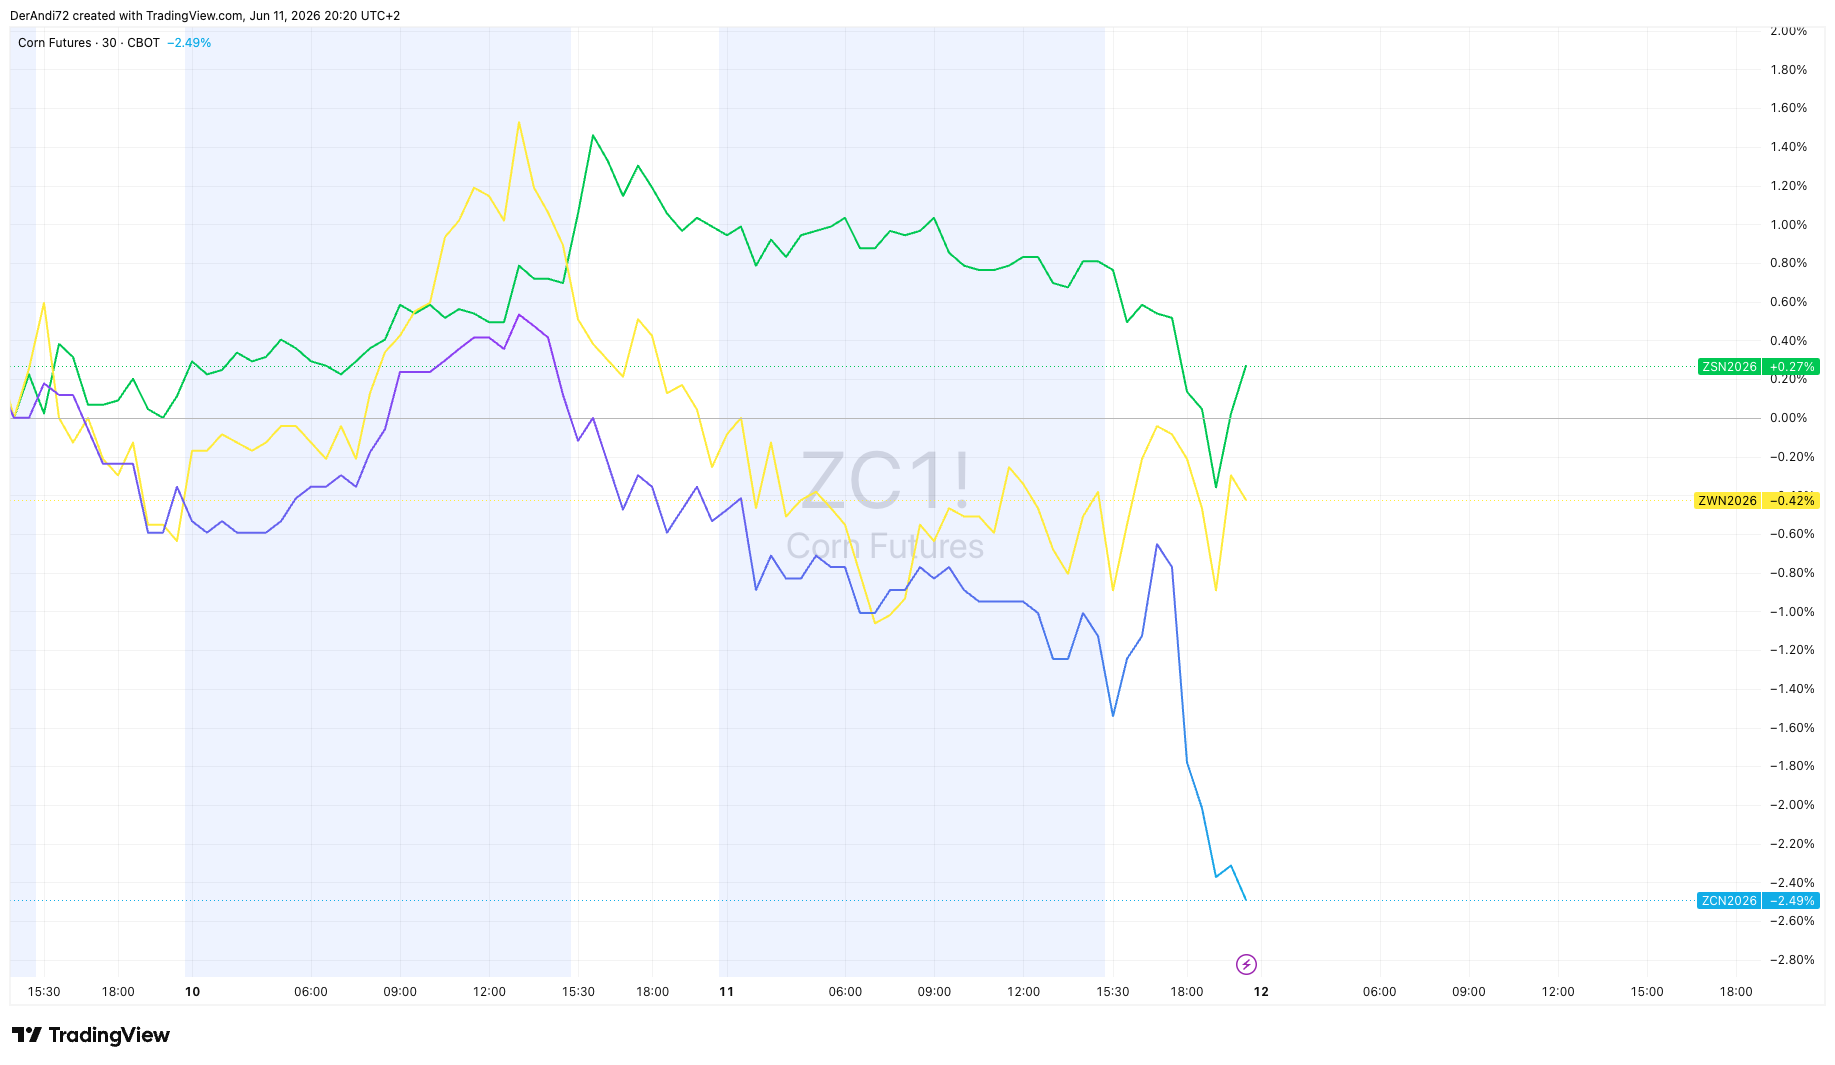
Corn: no fresh U.S. catalyst, higher global stocks
Corn was slightly disappointing from a bullish trader’s perspective. The U.S. corn balance sheet was almost unchanged compared with May.
U.S. corn production remained at 15.995 billion bushels. Exports stayed at 3.150 billion bushels, and ending stocks were only fractionally raised from 1.957 to 1.960 billion bushels. The projected season-average farm price stayed unchanged at $4.40 per bushel.
The more important change came from the global side. World corn production was raised from 1,295.4 to 1,300.4 million metric tons. Global corn ending stocks increased from 277.5 to 281.2 million metric tons.
That does not make corn aggressively bearish, but it reduces the quality of immediate long setups. Corn now needs confirmation from weather, crop conditions, export demand, or a strong technical reversal.
For now, my bias is neutral to slightly bearish based on WASDE alone.
Soybeans: quiet headline, important product split
The U.S. soybean balance sheet was unchanged in the June WASDE. Production remained at 4.435 billion bushels, crush at 2.750 billion bushels, exports at 1.630 billion bushels, and ending stocks at 310 million bushels.
The projected average farm price also stayed unchanged at $11.40 per bushel.
Global soybean changes were also minor. World soybean production was reduced only slightly from 441.5 to 441.3 million metric tons, while global ending stocks increased marginally from 124.8 to 124.9 million metric tons.
For soybeans themselves, this is not a strong directional report. The more important story is the product split inside the soy complex. Soybean oil remains structurally stronger than soybeans, while soybean meal is more linked to crush dynamics and feed demand.
Soybean Oil: still the strongest WASDE story
Soybean oil remains the clearest bullish story in this report.
U.S. soybean oil use for biofuel stayed at 17.8 billion pounds. That is the key number in the entire soy complex. Domestic disappearance remained high at 32.75 billion pounds, while exports stayed very low at only 400 million pounds.
Ending stocks were revised slightly lower from 1.897 to 1.877 billion pounds. The projected average soybean oil price remained at 70 cents per pound.
This helps explain why soybean oil has remained strong even when crude oil has been weak. The market is not simply trading crude oil correlation. It is also trading a domestic biofuel demand story.
For traders, this does not mean chasing every upside spike. But it does mean soybean oil remains one of the most important agricultural contracts to monitor for pullback-reclaim setups, trend continuation patterns, and possible relative strength versus soybeans or soybean meal.
Sugar: WASDE turns against the bullish COT story
Sugar is one of the more interesting conflicts in this report. From a COT perspective, sugar has recently been attractive because of strong Commercial positioning. But the June WASDE itself was not supportive.
U.S. sugar production for 2026/27 was raised from 8.810 to 9.063 million short tons, raw value. Beet sugar production was increased from 4.722 to 4.939 million short tons, and Florida cane sugar production was also raised.
Ending stocks were revised higher from 1.673 to 1.785 million short tons. The stocks-to-use ratio increased from 13.5% to 14.3%.
Mexico production was also raised from 5.142 to 5.283 million metric tons.
That means the WASDE message is clearly different from the COT message. COT may still be early and important, but WASDE does not yet confirm a bullish supply story. For sugar, I would therefore avoid aggressive long positioning unless price action confirms a reversal.
Cotton: modestly supportive, but not explosive
Cotton received a small supportive adjustment in the June WASDE.
U.S. beginning stocks were lowered from 4.40 to 4.20 million bales. Production was unchanged at 13.30 million bales, while ending stocks were reduced from 3.90 to 3.70 million bales.
Globally, cotton production stayed unchanged at 116.04 million bales, but world use was raised slightly and ending stocks were lowered from 71.84 to 71.13 million bales.
This gives cotton a slightly bullish bias, but it is not a major shock. Cotton still needs confirmation from demand, macro sentiment, Chinese consumption, and price structure.
Livestock and dairy: mixed protein picture, weaker dairy tone
The livestock section was mixed. Beef production for 2026 was lowered, while cattle prices were raised slightly. This supports the idea that cattle remain fundamentally tight, but the report also lowered beef exports and included uncertainty around New World screwworm cases in the United States.
Pork production was raised slightly, but hog prices were lowered. Broiler production was raised, while broiler prices were lowered in the annual forecast.
Dairy was more clearly bearish. Milk production forecasts were raised for both 2026 and 2027. The 2026 all-milk price forecast was lowered from $21.25 to $20.70 per cwt. Cheese, nonfat dry milk, and whey price forecasts were also lowered for 2026.
For my own trading watchlist, livestock and dairy are secondary markets. But they remain useful for monitoring broader food inflation, agricultural pricing pressure, and relative commodity trends.
Trader takeaway
The June 2026 WASDE was more of a confirmation and adjustment report than a shock report. The strongest market signal remains soybean oil, while wheat and corn require more price confirmation.
- Wheat: U.S. bullish, global mixed
- Corn: slightly bearish due to higher global stocks
- Soybeans: neutral, with little direct WASDE impulse
- Soybean Oil: bullish due to persistent biofuel demand
- Sugar: bearish from WASDE, despite interesting COT positioning
- Cotton: slightly bullish after lower U.S. and world ending stocks
For active traders, the most important markets after this report are soybean oil, wheat, and corn. Soybean oil has the clearest structural demand story, wheat remains a weather-sensitive watchlist market, and corn needs a fresh catalyst after the increase in global ending stocks.
Deep dives after this report
This WASDE opens the door for several focused follow-up articles and TradingView analyses:
1. Soybean Oil & Biofuel Demand
Analyze soybean oil demand, biofuel use, crude oil correlation, crush margins, COT positioning, and ZL price reaction.
2. Wheat: U.S. Tightness vs Global Supply
Compare U.S. production cuts with higher Russia, Turkey, and Ukraine production. Add HRW, COT, seasonality, and weather risk.
3. Corn Weather Risk Map
Track U.S. Corn Belt weather, crop condition ratings, global stocks, seasonal tendencies, and possible spread trades.
4. Sugar: COT vs WASDE Conflict
Review Commercial positioning, higher U.S. sugar production, Mexico supply, Brazil, ethanol parity, and price confirmation levels.
Outlook into the next WASDE
The next WASDE reports will be important because the market is now moving from early 2026/27 projections into actual weather, crop condition, and demand confirmation.
- Wheat: Watch whether the U.S. production cut deepens or whether larger global crops continue to offset it.
- Corn: Follow crop condition ratings, U.S. weather, export demand, and whether higher global stocks cap rallies.
- Soybean Oil: Monitor whether price action continues to confirm the biofuel demand story.
- Soybeans: Watch crush pace, export demand, and relative performance versus soybean oil and meal.
- Sugar: Track whether price action respects the bearish WASDE update or starts confirming the bullish COT setup.
- Cotton: Watch demand signals, China, macro risk appetite, and whether lower stocks translate into price strength.
The key question for the July report will be whether soybean oil remains the strongest agricultural story — and whether wheat or corn can generate a cleaner weather-driven trading setup.