The Gold–Silver Ratio Explained
A deep-dive into one of the most revealing relationships in the precious metals space: how the balance between monetary demand (gold) and cyclical demand (silver) shifts across macro regimes.
The Gold–Silver Ratio is one of the oldest and simplest intermarket relationships in finance. Despite its simplicity, it provides powerful insight into market psychology, macro regimes, and the shifting balance between fear and growth.
This article takes a structured look at what the ratio really measures, how it behaves across different economic environments, and how traders can use it as a context tool — without turning it into an overfitted signal.
1) What Is the Gold–Silver Ratio?
The Gold–Silver Ratio (GSR) is calculated by dividing the price of gold by the price of silver:
Example: If gold trades at 2,000 USD and silver trades at 25 USD, the ratio equals 80. This means one ounce of gold buys 80 ounces of silver.
Unlike a price chart, the ratio does not measure direction. It measures relative performance — which metal is outperforming.
2) Two Metals, Two Roles
Gold: The Monetary Metal
- Held by central banks
- Acts as a reserve asset
- Benefits from financial stress
- Often supported by falling real yields
Silver: The Hybrid Metal
- Monetary history
- Strong industrial demand
- Higher volatility
- More sensitive to growth expectations
In simple terms: gold behaves defensively, silver behaves cyclically. The ratio tracks the market’s preference between monetary safety and economic expansion.
3) Gold–Silver Ratio (Long-Term Chart)
The long-term ratio chart reveals structural trends, long consolidation phases, and sharp mean-reversion moves during macro transitions.
4) Annotated Gold–Silver Ratio Overview
The following chart includes annotations highlighting trend direction, extreme zones and structural characteristics of the ratio.
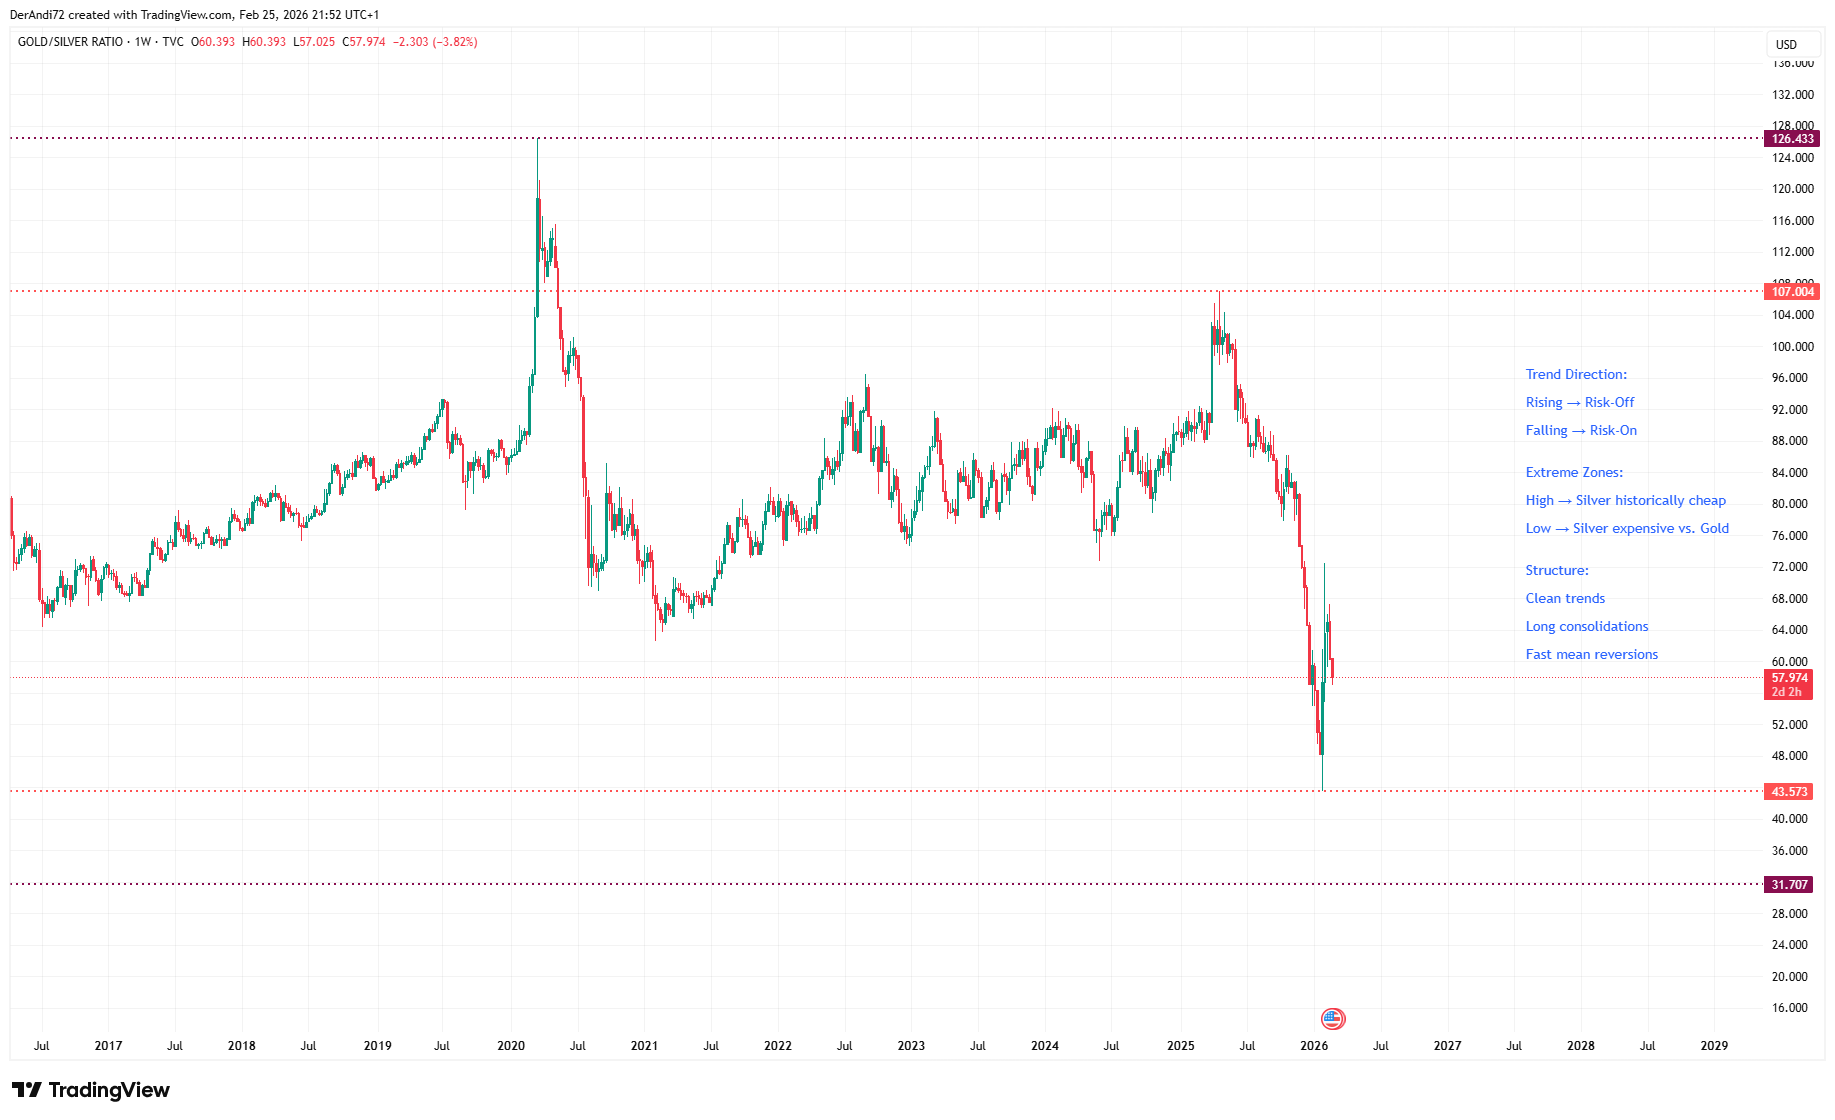
Rising ratio phases typically align with risk-off environments, while falling phases often coincide with growth-driven cycles. Extreme levels tend to reflect macro stress or late-cycle acceleration.
5) Rising vs. Falling Ratio
Rising Ratio
- Gold outperforming silver
- Risk-off sentiment
- Economic uncertainty
- Defensive capital flows
Falling Ratio
- Silver outperforming gold
- Risk-on sentiment
- Improving growth outlook
- Industrial demand strength
From a trader’s perspective, the ratio is best used as a macro filter. It provides regime awareness rather than entry signals.
6) Extreme Zones
When the ratio reaches historically high levels, silver is often considered relatively “cheap” compared to gold. Conversely, very low ratio levels may indicate silver is relatively “expensive”.
However, extremes can persist longer than expected. Mean reversion is possible — but not guaranteed.
7) Practical Use Case
Instead of using the Gold–Silver Ratio as a signal, use it as a context framework:
- High ratio → Favor gold exposure in defensive environments
- Falling ratio → Consider silver during reflationary phases
- Combine with structure, volatility, and positioning
The ratio doesn’t tell you when to trade — it helps you understand what kind of market you are operating in.