How I Use COT and Seasonality Together
A practical workflow for commodity traders: combine positioning (COT) with time-based tendencies (seasonality) to build a directional bias, filter low-quality setups, and stay aligned with the “bigger hand” in the market. Examples: Wheat (ZW) and Corn (ZC).
Seasonality = Timing
- Defines when a market historically tends to perform best/worst.
- Works especially well in agricultural commodities.
- Creates “opportunity windows” — not entry signals.
COT = Context
- Shows how key participant groups are positioned.
- Helps to define structural bias (long/short/neutral).
- Best used as a slow, higher-level filter.
Combination = Edge
- Seasonality finds the window.
- COT tells you whether the window is supported.
- The goal is fewer, higher-quality trades — not more signals.
Why combine COT and Seasonality?
Seasonality is one of the most useful “structural” tools in commodities because many markets are tied to biological cycles (planting, growing, harvest) and predictable demand patterns. But seasonality alone is not enough. A seasonal tailwind can fail when positioning and risk appetite are misaligned.
The Commitment of Traders (COT) report helps me add context. In simple terms: Seasonality tells me when to pay attention, and COT helps me decide how aggressive I want to be.
My COT workflow (simple and practical)
I focus on a small set of COT concepts that translate well into repeatable analysis. I’m not trying to predict turning points from a single report. I want to understand whether the market is positioned in a way that supports the seasonal tendency — or fights it.
1) Commercial positioning as a bias tool
- Commercials are typically the most informed hedgers in physical markets.
- I track their net positioning and how it changes (improving vs deteriorating).
- Strong commercial support during a seasonal window increases my conviction.
2) Extreme positioning as a caution signal
- If positioning is extremely stretched, I become more selective with entries.
- I avoid “hero trades” against a crowded positioning regime.
- When seasonality and positioning disagree, I reduce size or skip.
My seasonality workflow (timing windows)
Seasonality is most useful when it is implemented as a calendar window. That keeps it objective and testable. I don’t treat seasonality as “magic.” I treat it as a probability tilt that tells me: this is the time of year where I want to look for opportunities.
How I define seasonal windows
- Windows are defined by start/end dates in MMDD format (e.g.,
0315). - Each market can have multiple windows (bullish / bearish / transitional).
- Windows help me avoid random trading outside historically favorable periods.
How I combine COT and Seasonality (decision framework)
I use seasonality to define when a market deserves attention. The Commercial Net Position (red line) defines directional bias. The COT Index adds context about how mature or stretched that positioning already is.
I use a simple three-bucket approach. The point is not to be perfect — the point is to be consistent.
✅ Best Case
- Seasonality supports the direction
- COT supports the direction (commercial bias improving)
- Price confirms (breakout / reclaim / structure shift)
⚖️ Filtered Case
- Seasonality supports the direction
- COT is mixed / neutral
- I reduce expectations (smaller size, tighter selection)
⛔ No Trade
- Seasonality says “go”
- COT strongly disagrees (structural headwind)
- I skip or wait for a clear regime shift
Wheat & Corn chart examples (live workflow)
The charts below illustrate my real-world analysis workflow using Wheat (ZW) and Corn (ZC). The seasonality overlay highlights predefined calendar-based opportunity windows. COT data is added as a separate analysis layer to provide positioning context.
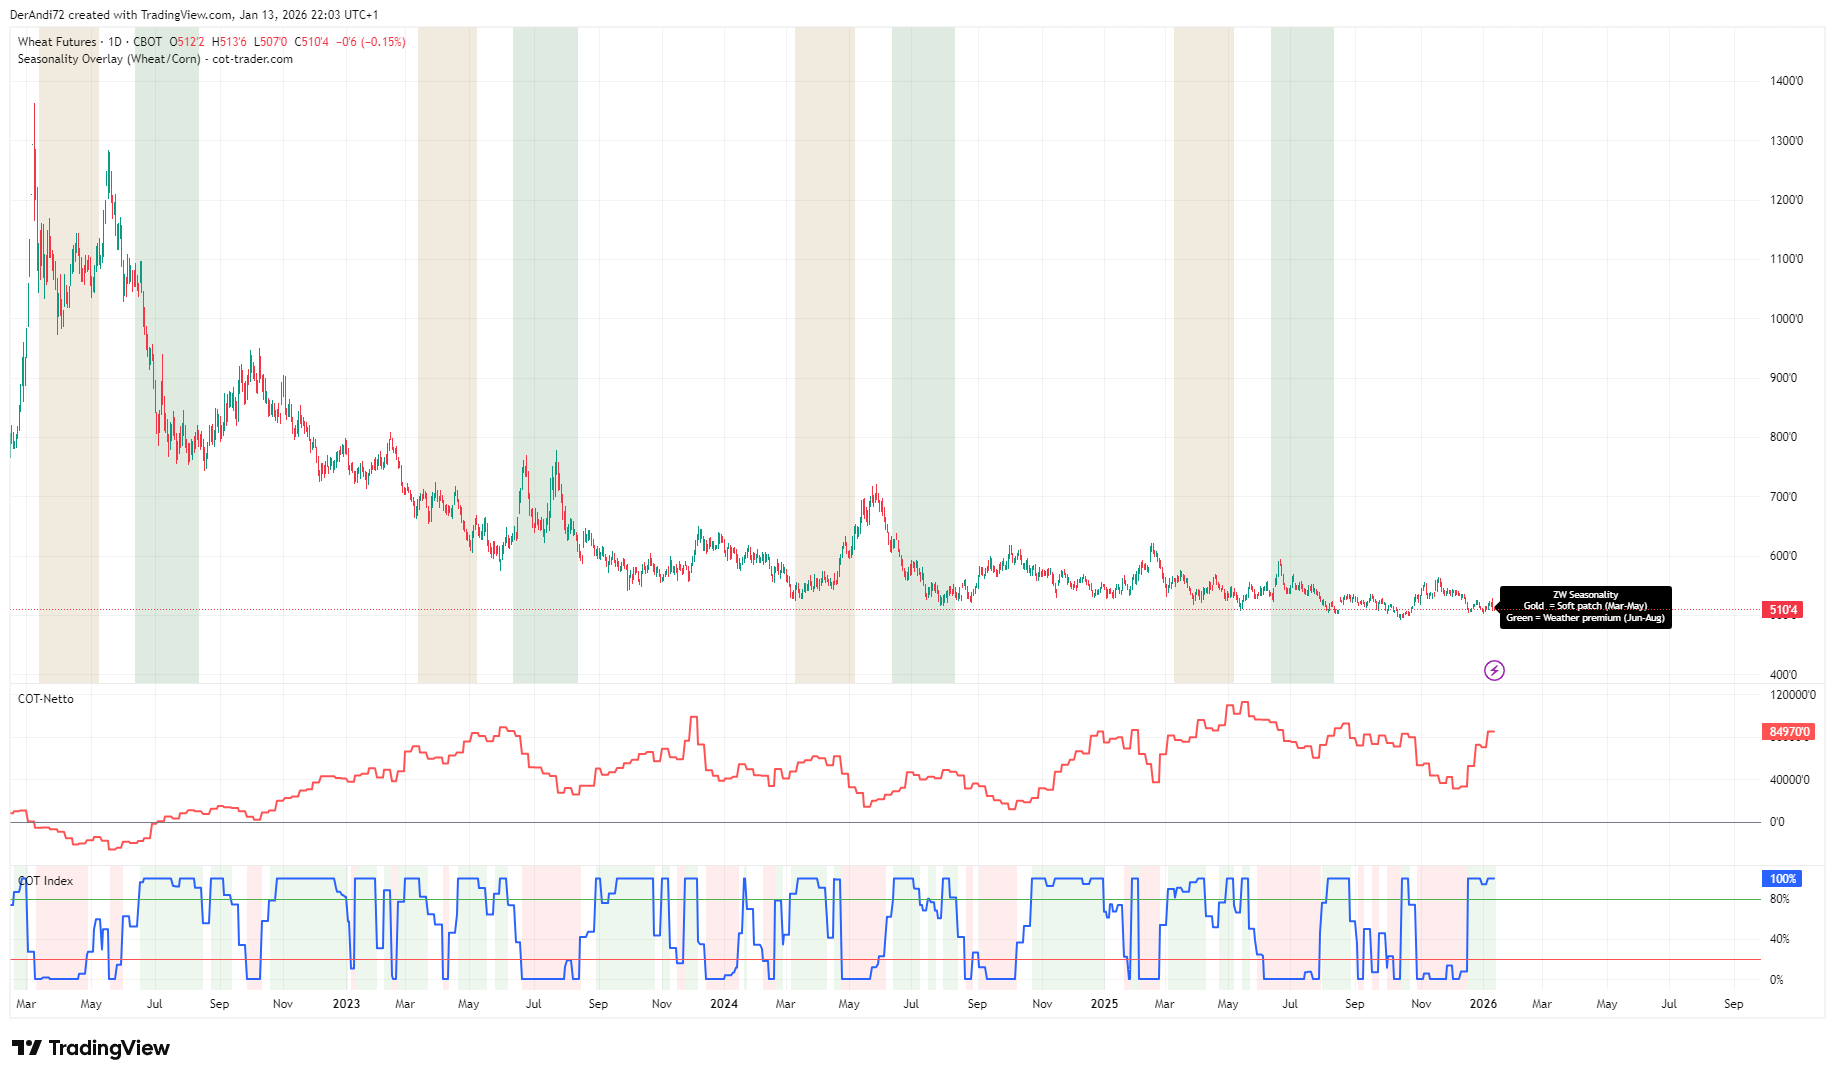
Example 1 — Wheat (ZW)
- Seasonality: highlights the calendar window to focus on.
- COT Net (Commercials): the red line shows directional positioning.
- COT Index: the 0–100 scale adds context (thresholds at 80/20).
Example 2 — Corn (ZC)
- Seasonality: identifies spring and pollination risk windows.
- COT Net (Commercials): the red line provides bias context.
- COT Index: helps detect stretched positioning (80/20).
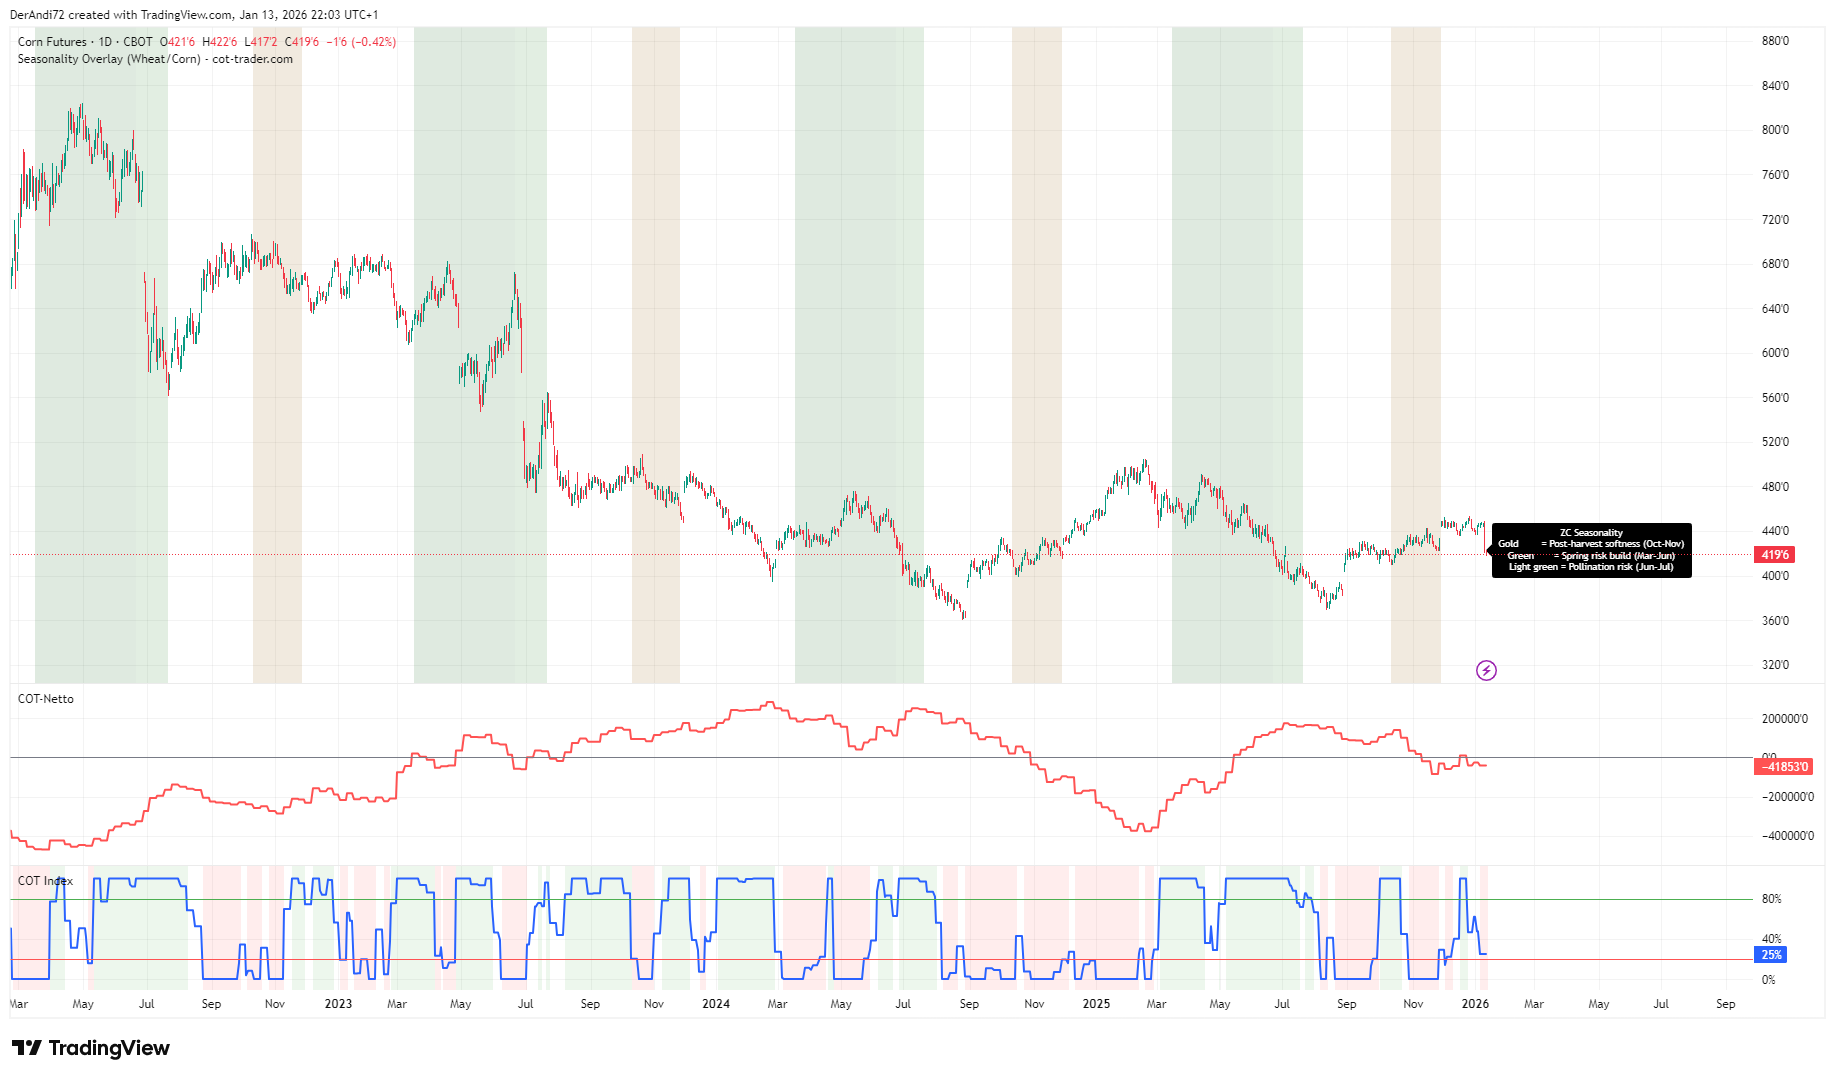
The seasonality overlay marks historical time windows only.
The red line in the COT panel represents Commercial Net Position.
The COT Index (0–100), based on weekly data, is shown on a daily chart purely as a higher-level context tool. Thresholds at 80 / 20 help identify stretched positioning. None of these elements are entry signals.
How to recreate my chart setup (in TradingView)
- Open a ZW or ZC futures chart (or your preferred CFD mapping).
- Add the indicator: Seasonality Overlay (Wheat/Corn) - cot-trader.com.
- Enable Auto-detect symbol root (ZW/ZC).
- Disable window start labels for clean screenshots.
- Add a separate COT Net (Commercials) panel (red line).
- Add a separate COT Index (Commercials) panel with thresholds at 80/20.
- Use price structure for execution: breakouts, reclaims, or trend continuation.
What this approach does NOT do
- It does not predict turning points on a single date.
- It does not replace risk management or position sizing.
- It does not guarantee profitability — it improves decision quality.
- It does not remove drawdowns; it helps you avoid low-quality timing.
Conclusion
Combining COT and seasonality is a simple way to trade commodities with more structure: seasonality provides the calendar-based opportunity window, and COT provides positioning context. Together, they help me trade less, but with better quality — and with a clearer understanding of what the market is likely doing beneath the surface.
Especially in agricultural commodities like Wheat and Corn, this combination helps me stay patient, avoid overtrading, and align seasonal tendencies with real positioning in the futures market.